← All projects

Research & Instrumentation

Characterization of the NIRPS Guiding Camera for Close Visual Binaries

I measured how faint a companion star can be and still be seen by the NIRPS guiding camera, and how much of its light can leak into the spectrograph's fibre.

Year
2025
Context
Astrophysics Laboratory (APL) project, MSc first semester, University of Geneva
Supervisors
Prof. François Bouchy, Lina Messamah (Observatoire de Genève)
Built with
Python, NumPy, SciPy, Astropy, Photutils
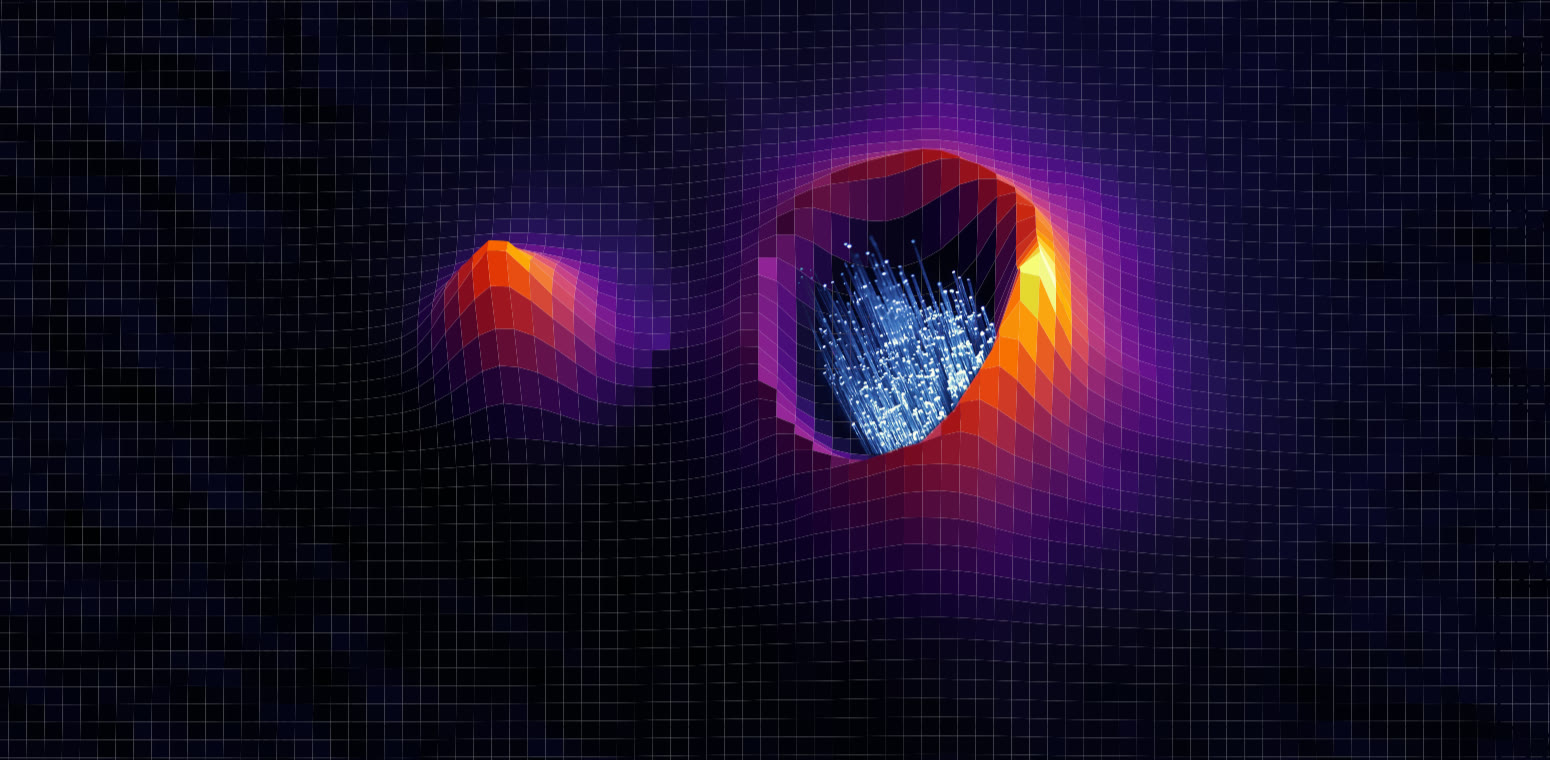
A 3D surface of a guiding-camera image: the target star forms a bright crater with the fibre in its centre, drawn as a bundle of glowing blue strands, and a smaller companion peak rises beside it.
My visualisation of a binary system, based on a real guiding-camera image, with a schematic fibre centred on the target star. The companion's light spreads towards the fibre.

The problem

A large fraction of stars are in binary or multiple systems, and many of them are expected to have planets. To study those planets, we need to be sure whose light we are measuring.

NIRPS is a near-infrared spectrograph on the ESO 3.6 m telescope at La Silla, Chile, that searches for exoplanets with the radial-velocity method. Starlight reaches it through an optical fibre that sees only 0.4″ of sky, centred on the target star. If a companion star is close, part of its light can also fall into the fibre, mix with the target's spectrum and bias the measurement.

So I asked two questions: when can the guiding camera see the companion, and how much of its light gets into the fibre?
On the sky fibre Brightness through both stars (stretched scale) fibre
target star companion, filled where its light falls into the fibre. Illustration, not measured data.
guiding camera fibre → spectrograph pierced mirror ↗ light from the telescope
target star light around it, including a companion. Redrawn from my own diagram.

Seeing the star and the fibre at once

The light from the telescope reaches a mirror with a small hole in the middle. The target's light passes through the hole into the fibre. Everything around it is reflected to the guiding camera, which keeps the star centred on the hole.

That is how the camera can watch the star and the fibre at the same time: every image shows the star with a dark hole where the fibre is. The catch is that the camera only sees the light that does not go into the fibre, so it cannot measure the leak directly.

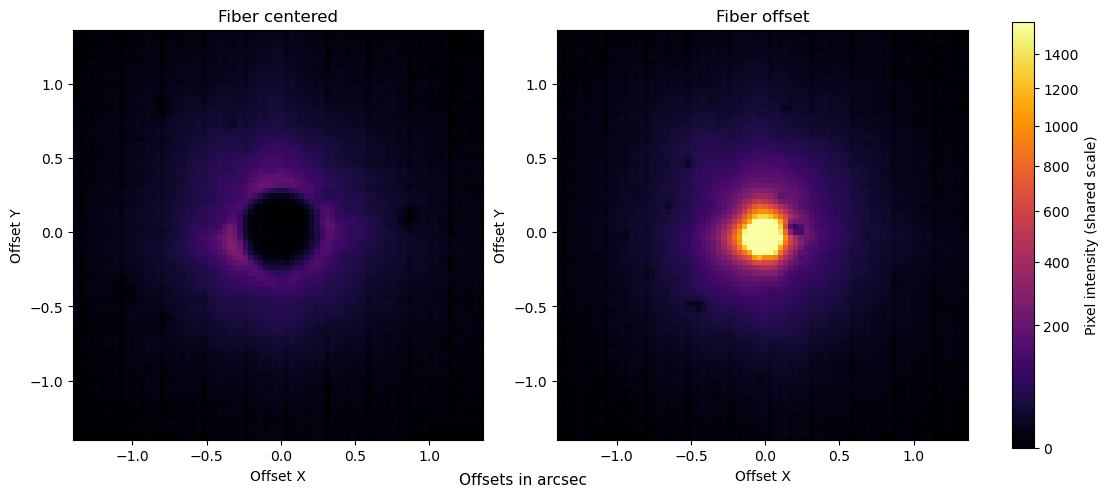
Two guiding-camera images on the same colour scale. Left: the star with a dark circular hole at its centre, where the fibre is. Right: the same star with the fibre moved away, showing a bright compact core.
Left: the star centred on the fibre, with the hole in the middle. Right: the fibre moved away, so the whole star is visible. I used these offset images to measure the PSF, the shape of a star's image: a sharp core and a fainter halo (two Moffat profiles, FWHM 0.26″ and 0.44″). The halo is the part that reaches into the fibre.

Removing the star's glow

Before searching for companions, I removed the star's own light so that anything companion-sized stands out. I used five filtering steps adapted from Wahhaj et al. (2013).

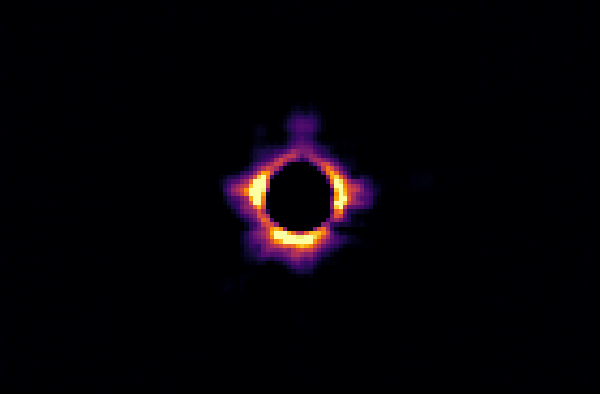
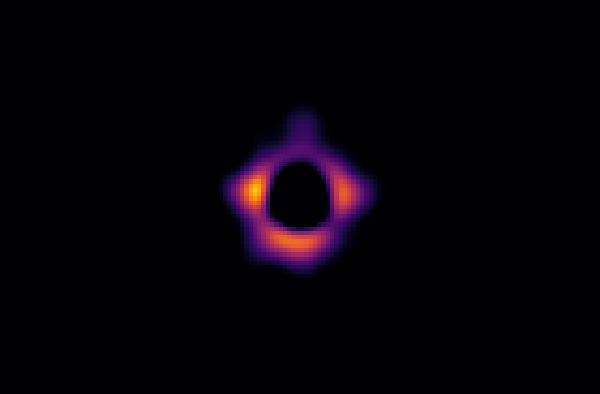
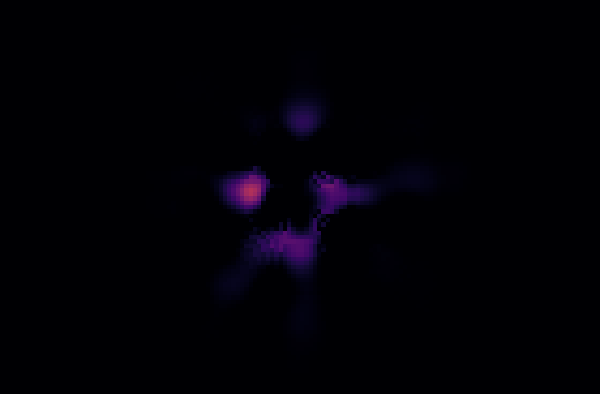
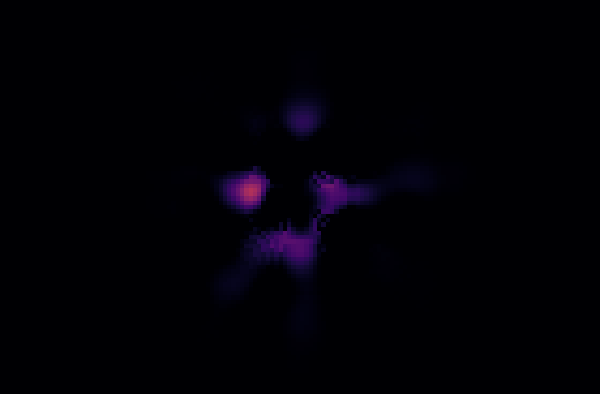
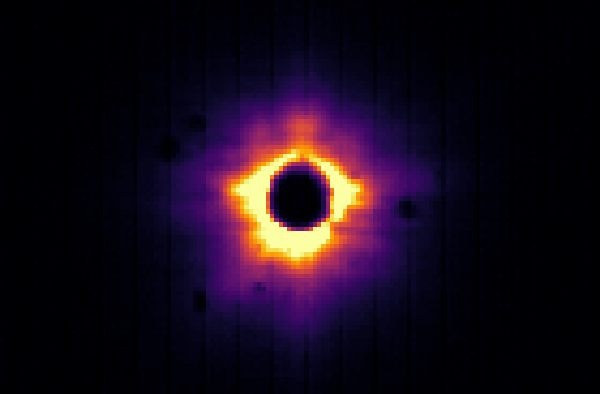
The guiding-camera image: a bright ring of starlight around the dark fibre hole, with faint vertical stripes from the detector. After halo subtraction: only a thinner, sharper ring remains around the hole. After smoothing: the ring is softer and the pixel noise is gone. After azimuthal subtraction: the ring is gone, leaving only a few faint blobs near the centre. After stripe correction: the final filtered image, almost empty apart from faint residuals near the centre.
Before filtering: the star, the dark fibre hole, the halo and the detector's vertical stripes.

Fake companions and 95% completeness

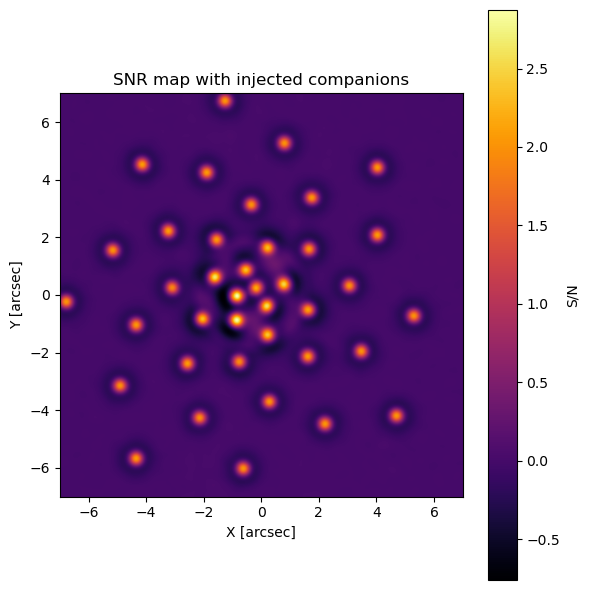
To find out what the camera can detect, I injected artificial companions, made from the measured star image, in a spiral around the star: one at each separation. Each image then went through the same filtering, and a companion counts as found when a peak above the detection threshold appears at its position.

I rotated the spiral through 20 starting angles, 18° apart, so that every separation has 20 companions in different directions around the star. Then I made them all fainter step by step.

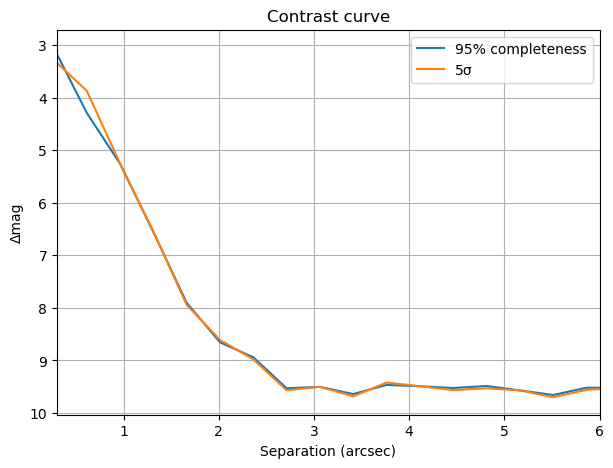
At each separation, the detection limit is the faintest brightness at which 19 of the 20 are still found: 95% completeness. Together, these limits form the contrast curve.

Placing a spiral of fake companions found at the circled separation: – / 20 19 ↓ fainter ↓ separation from the star →
fake companion found, and the 19-of-20 limit. Illustration of the method, not measured data.
A signal-to-noise map of the filtered image: about forty bright dots, the fake companions, arranged in a spiral around the centre on a flat purple background.
The real thing: fake companions in one of my filtered images, shown as a signal-to-noise map. The star's halo has been removed, so the companions stand out against the background.

How faint can a companion be?

The fake companions give the contrast curve: how much fainter than the target a companion can be and still be detected, at each separation.

Close to the star, its halo hides companions. Beyond about 2.5″, the camera finds companions 9.6–9.8 magnitudes fainter than the target, which is around 7,000 to 8,000 times fainter. The curve closely follows a quicker estimate that uses only the noise level (5σ).

Contrast curve: magnitude difference against separation in arcseconds. Two nearly identical lines, 95% completeness and 5 sigma, drop from about 3 at 0.3 arcseconds to about 9.5 at 2.7 arcseconds, then stay flat out to 6 arcseconds.
Contrast curve from the fake companions (95% completeness) and from the noise alone (5σ). Lower means fainter companions can be detected.
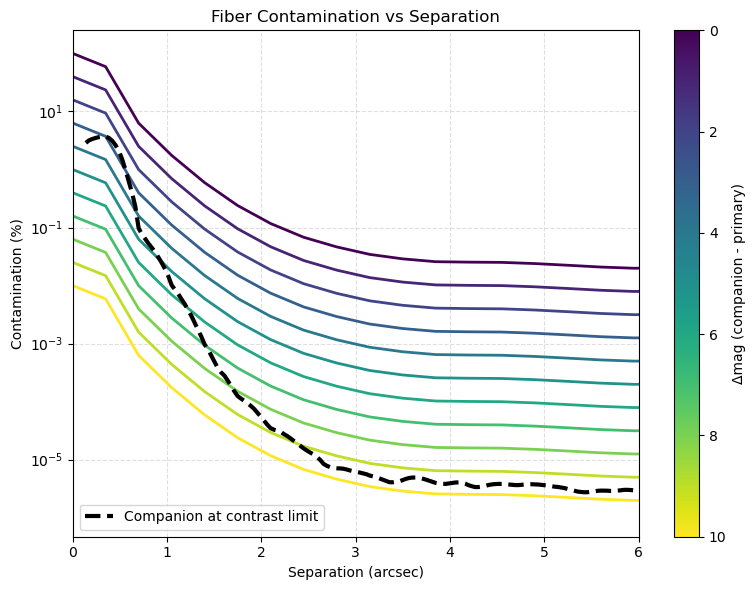
Fibre contamination in percent on a log scale against separation, with one coloured curve per magnitude difference from 0 to 10. All curves drop steeply over the first 2 arcseconds and flatten after about 3. A dashed black line, the companion at the contrast limit, cuts across the curves.
Fibre contamination against separation. Colours give how much fainter the companion is; the dashed line is a companion right at the detection limit.

How much light leaks in?

To estimate the leak, I placed a shifted and scaled copy of the measured star image at each separation and brightness, and measured how much of its light falls into the fibre. The contamination drops steeply with separation and changes little beyond about 3″.

Companions above the dashed line should be seen by the guiding camera. Those below it can stay invisible while still contaminating the fibre, especially at small separations. So a non-detection in the guiding images is not enough: it has to be combined with a contamination estimate.

A companion the guiding camera can't see can still leak light into the fibre.

Limitations

The analysis uses observations of one star (q Vel) from a single night. The contamination estimate also assumes that the companion's image has the same shape as the measured image of the target star.

Report and summary

Credits

Supervised by Prof. François Bouchy and Lina Messamah, Observatoire de Genève, University of Geneva.

Related projects